Introduction
A red build on a Friday afternoon is never a small problem. One failed test or one missing environment variable can block a hotfix, hold up a release, and leave a whole team reading logs instead of shipping. A healthy CI/CD pipeline should feel like plumbing: you only notice it when it breaks.
When it does break, the instinct is to hit rerun and hope. Sometimes that works, which is exactly why it becomes a habit. But a pipeline that passes on the third attempt has not been fixed. It has been tolerated, and the cost shows up as slower releases, lost focus, and a team that slowly stops trusting the build.
This guide covers what a CI/CD pipeline is, how it works, and why it fails. You will get symptoms, root causes, diagnostic steps, and fixes for twelve common failure types, followed by a troubleshooting workflow, security guidance, and a checklist you can use today. Code examples are illustrative, so adapt them to your own platform.
What Is a CI/CD Pipeline?
Short answer:A CI/CD pipeline is an automated workflow that builds, tests, and delivers code changes. Continuous integration (CI) merges and validates changes frequently, while continuous delivery or continuous deployment (CD) prepares and releases them, so teams get faster feedback and fewer manual steps.
A pipeline, in software terms, is a sequence of automated stages that carries a change from a developer’s machine to a running application. Each stage does one job and hands its result to the next. If a stage fails, the pipeline normally stops, and that is the point: bad changes get caught early. People also call this a DevOps pipeline, because it joins development and operations work in one automated path.
So what do CI and CD mean in practice? Continuous integration is the habit of merging code into a shared repository often, with every change built and tested automatically. The build step is sometimes called continuous build. You may also hear “continuous development” used for the wider, ongoing act of developing software within the lifecycle. It is not another name for deployment.
| Concept | Explanation |
| Continuous Integration | Developers frequently integrate code into a shared repository, followed by automated validation. |
| Continuous Delivery | Changes are automatically built, tested, and prepared for release. Production deployment generally needs approval or a deliberate action. |
| Continuous Deployment | Every change that passes the required pipeline checks is deployed to production automatically. |
The difference between continuous delivery and continuous deployment comes down to one question: does a human decide when to release? Teams adopt pipelines because automation replaces repetitive manual work, gives faster feedback, and makes releases repeatable.
How Does a CI/CD Pipeline Work?
Most CI/CD workflows follow the same arc. Here is what happens at each step and how a failure interrupts it:
- Code development. A developer writes a change on a branch.
- Version control. The commit is pushed, and a webhook or trigger starts the pipeline. A missed trigger means nothing runs.
- Source integration. The pipeline checks out the right commit or merge result.
- Automated build. Code is compiled or packaged. Build errors stop everything.
- Dependency installation. Packages are fetched. Registry or version problems fail here.
- Automated testing. Unit, integration, and end-to-end tests run.
- Quality and security checks. Linters, scanners, and gates decide whether the change is acceptable.
- Artifact creation. The build output is versioned and stored.
- Staging deployment. The artifact is deployed to a production-like environment.
- Production release. The change goes live, automatically or after approval.
- Monitoring and feedback. Metrics and alerts show whether the release is healthy.
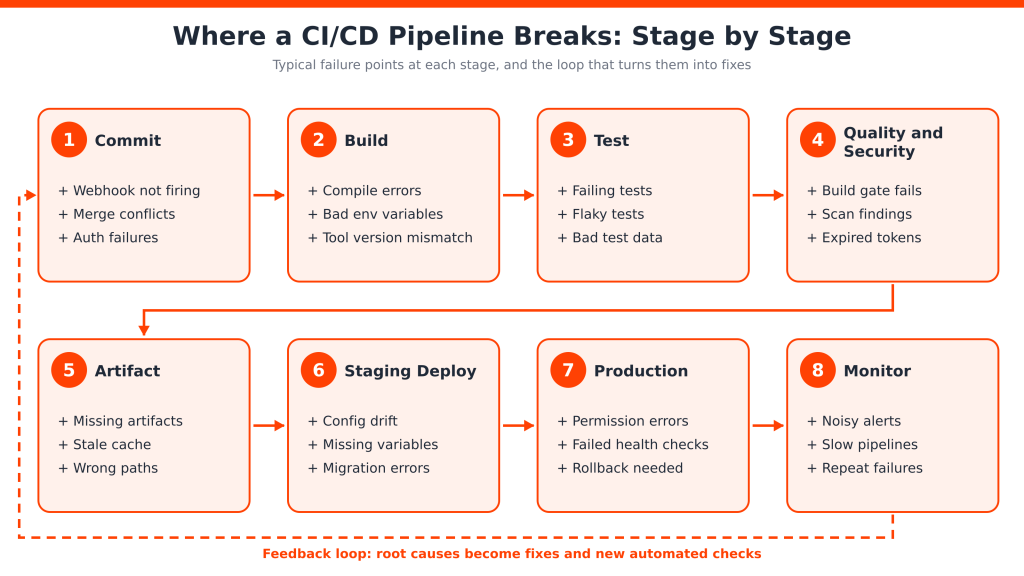
The infographic groups these steps into eight stages and shows where each kind of failure typically appears. Actual stages and approval gates vary by team, tool, and release strategy, so treat this as a common pattern rather than a standard.
What Are CI/CD Pipeline Failures?
A CI/CD pipeline failure is any run that stops, errors out, or produces an unusable result before the change reaches its intended destination. It is a broader idea than a single broken job. Compare these related cases:
- Failed build: the code or build configuration cannot produce an artifact
- Failed test: the build works, but validation finds a problem.
- Deployment failure: the artifact is fine, but releasing it fails.
- Configuration error: the pipeline definition itself is wrong, such as invalid YAML.
- External or infrastructure failure: a registry, API, network, or runner problem, with nothing wrong in your code.
A pipeline can fail in one stage while every other stage is healthy. That is why the first diagnostic move is always to identify the exact failed stage. Debugging a deployment problem by rereading build code wastes an hour.
Common CI/CD Pipeline Failures in 2026: Causes and Solutions
The map below summarizes the twelve failure types covered in this section. Each one follows the same pattern: what happens, the symptoms you will see, the root causes, how to troubleshoot, and how to fix and prevent it.
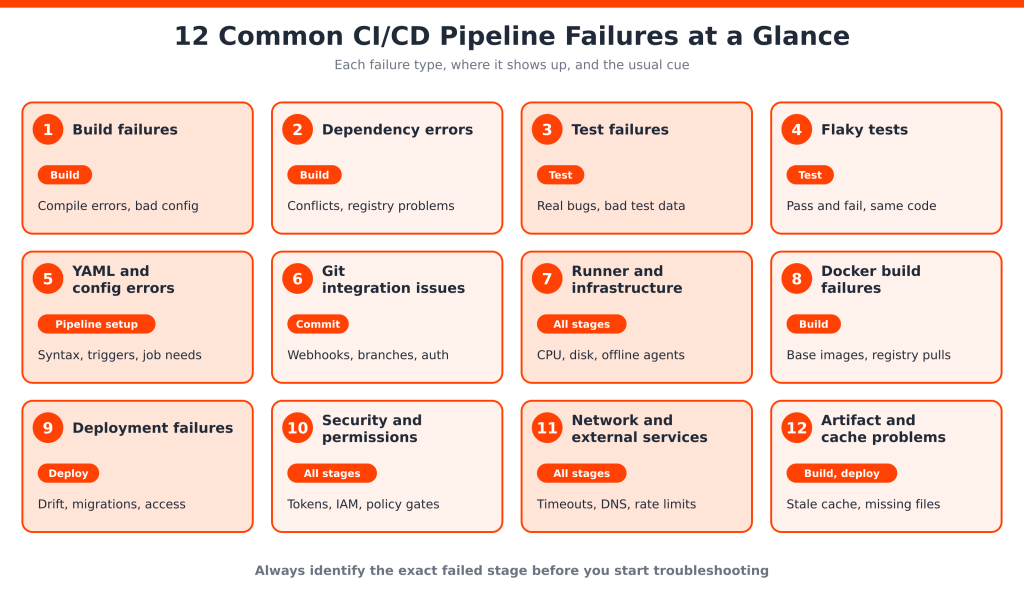
Build Failures
- What happens: The build stage stops before producing an artifact.
- Symptoms: Compiler errors, “command not found,” or “module not found” near the top of the job log.
- Root causes: Code errors, wrong build configuration, missing files, invalid environment variables, or a runtime or tool version that differs from your local machine.
- Troubleshoot: Find the first error in the log, then run the same command in the same container image locally. Compare versions with node –version or your language’s equivalent.
- Solution: Pin tool versions, build in a defined container image, and validate required variables at the start of the job so failures are early and clear.
Dependency and Package Management Errors
- What happens: The install step fails, or quietly installs different versions than expected.
- Symptoms: Messages such as ERESOLVE unable to resolve dependency tree, registry 404 or 5xx responses, and install timeouts.
- Root causes: Version conflicts, unlocked version ranges, registry outages, or packages removed upstream.
- Troubleshoot: Read the package manager output, diff the lockfile against the last good run, and try the install outside CI to separate a registry problem from a code problem.
- Solution: Commit lockfiles and install with npm ci or your ecosystem’s equivalent, pin versions, cache dependencies, and use a private registry or mirror for critical packages.
Automated Test Failures
- What happens: Unit, integration, or end-to-end tests fail and block the pipeline.
- Symptoms: Red test reports, assertion errors, or “connection refused” to a test database.
- Root causes: Genuine regressions, test environment differences, or incorrect and shared test data.
- Troubleshoot: Open the test report, run the failing test alone, and check whether it also fails locally. If it only fails in CI, compare service versions, seed data, and environment variables.
- Solution: Fix the code or the test, make test data self-contained, and run dependencies such as databases as pinned container versions.
Flaky Tests and Unstable Builds
- What happens: The same commit passes and fails without any code change.
- Symptoms: Failures that vanish on rerun, differ between runs, or depend on timing or test order.
- Root causes: Timing assumptions, race conditions, shared state or data, and unstable external services.
- Troubleshoot: Rerun the same commit several times, track results per test over time, and repeat the test in a loop locally with randomized order.
- Solution: Quarantine the test, then fix it. Replace fixed sleeps with explicit waits, isolate data, and stub external services. Repeated reruns hide the signal and teach the team to ignore red builds, so they are not a long-term answer.
Pipeline Configuration and YAML Errors
- What happens: The pipeline never starts, skips jobs, or fails immediately.
- Symptoms: “Invalid YAML,” “job depends on unknown job,” or jobs missing from the run.
- Root causes: Indentation mistakes, wrong keys, bad job dependencies, misnamed stages, trigger rules that do not match the event, wrong variable scope, or missing permissions.
- Troubleshoot: Use the platform’s validator, such as the CI Lint tool in GitLab or a linter like actionlint for GitHub Actions, and compare trigger conditions with the event that occurred.
- Solution: Lint configuration in pull requests and move repeated logic into reusable templates.
Here is a small GitHub Actions example (illustrative, not a production setup):
on:
pull_request:
branches: [main]
jobs:
test:
runs-on: ubuntu-latest
timeout-minutes: 15
steps:
– uses: actions/checkout@<full-commit-sha>
– run: npm ci
– run: npm test
The branches filter matches the pull request’s target branch, a common reason a workflow never triggers. The timeout-minutes setting stops a hung job from consuming runner time.
Git and Version Control Integration Problems
- What happens: The pipeline does not trigger, or checks out the wrong code.
- Symptoms: No pipeline after a push, “merge conflict,” “repository not found,” or “authentication failed.”
- Root causes: Failed webhook deliveries, branch rules that exclude the branch, incorrect commit references, and expired deploy keys or tokens.
- Troubleshoot: Check webhook delivery history, confirm branch filters, inspect the checked-out ref with git log -1, and verify token scope and expiry.
- Solution: Use branch protection with required status checks, validate every pull request, rotate credentials on a schedule, and prefer short-lived access over long-lived personal tokens.
Infrastructure and Runner Failures
- What happens: Jobs fail or hang for reasons unrelated to your code.
- Symptoms: “No space left on device,” out-of-memory kills (often exit code 137), jobs stuck pending, or runners offline.
- Root causes: Too little CPU or memory, disk exhaustion, no available runners, network interruptions, container runtime problems, or differences between runner images.
- Troubleshoot: Print df -h and free -m at the start of the job, check runner status and queue times, and compare against a freshly provisioned runner.
- Solution: Right-size runners, clean workspaces, autoscale capacity, standardize on ephemeral runner images, and monitor utilization.
Docker and Container Build Failures
- What happens: An image fails to build, push, or pull.
- Symptoms: “failed to solve,” “pull access denied,” “manifest unknown,” or a pull rate limit error from a public registry.
- Root causes: Dockerfile mistakes, a wrong or removed base image tag, expired registry credentials, rate limits, or a CPU architecture mismatch.
- Troubleshoot: Rebuild with docker build –progress=plain . to see full output, confirm the registry login, and check the target platform.
- Solution: Pin base images by version or digest, authenticate pulls or use a registry mirror, use multi-stage builds, and scan images before publishing. See the Docker documentation for build details.
Deployment Failures
- What happens: A staging or production deployment fails, or ships something broken.
- Symptoms: Pods in CrashLoopBackOff, failed health checks, migration errors, or “forbidden” responses.
- Root causes: Wrong configuration, missing environment variables, configuration drift between environments, database migration problems, permission gaps, and incompatible versions.
- Troubleshoot: On Kubernetes, use kubectl rollout status, kubectl describe pod, and kubectl logs, then compare configuration between environments.
- Solution: Validate in staging, add readiness and health checks, make migrations backward compatible, verify after every release, and keep a rollback ready, for example kubectl rollout undo. The Kubernetes documentation covers rollout behavior.
Security and Permission-Related Failures
- What happens: A job is denied access or blocked by a gate.
- Symptoms: 401 or 403 errors, “access denied,” “certificate verify failed,” or a scan job that fails.
- Root causes: Expired tokens, secrets set in the wrong scope, missing IAM permissions, expired certificates, vulnerability findings above the threshold, and strict policy gates.
- Troubleshoot: Confirm the secret exists where the job runs (protected variables are not exposed to unprotected branches), check token expiry, compare the role’s permissions to what the job calls, and read the scan report.
- Solution: Use a secrets manager, least-privilege roles, and short-lived credentials. Set gates by severity and exploitability instead of blocking on everything.
Network and External Service Failures
- What happens: A job fails when it reaches for something outside the runner.
- Symptoms: Timeouts, “could not resolve host,” HTTP 429 rate limits, or registry 5xx errors.
- Root causes: API timeouts, DNS problems, third-party outages, rate limiting, registry downtime, and cloud service interruptions.
- Troubleshoot: Test connectivity from the runner with curl -I and nslookup, check provider status pages, and read the response codes.
- Solution: Use timeouts and a bounded number of retries with backoff, mirror critical dependencies, health-check dependencies before tests start, and define a fallback.
Artifact and Build Cache Problems
- What happens: A later job cannot find an output, or uses stale content.
- Symptoms: “File not found” in a deploy job, builds that differ between runs, or strange errors that disappear when the cache is cleared.
- Root causes: Wrong artifact paths, expired artifacts, corrupted or stale caches, and unversioned outputs.
- Troubleshoot: Rerun without the cache, list the artifact contents, and compare checksums between builds.
- Solution: Key caches on the lockfile hash, version artifacts by commit SHA, build once and promote the same artifact through environments, and aim for reproducible builds.
How to Troubleshoot a Failed CI/CD Pipeline: Step-by-Step Process
When a run fails, resist the rerun button and follow a fixed order. It keeps you from chasing side effects.
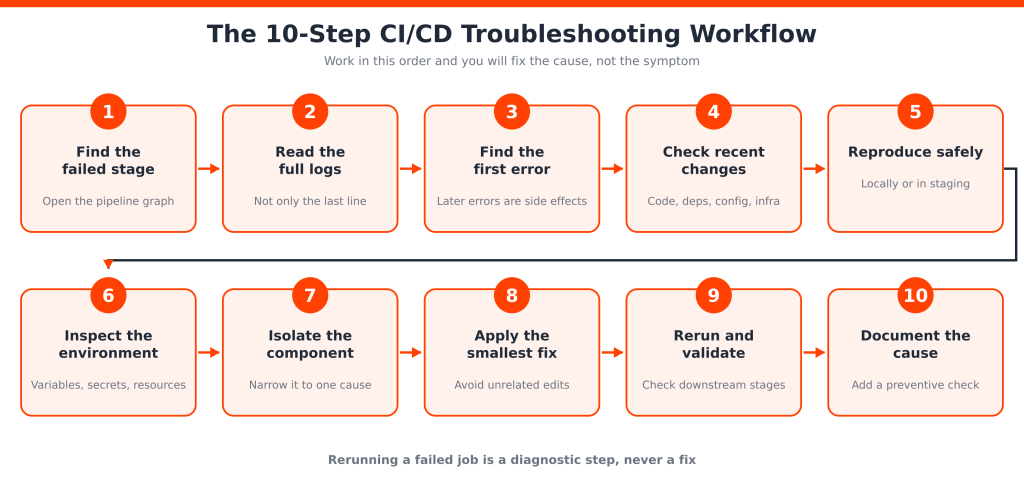
- Identify the failed stage. Open the pipeline graph.
- Review the full logs, not just the summary.
- Locate the first meaningful error. Later messages are often consequences.
- Check recent changes to code, dependencies, configuration, and infrastructure.
- Reproduce the problem in a controlled local or staging environment.
- Inspect environment variables, secrets, permissions, and resources.
- Isolate the failing component.
- Apply the smallest appropriate fix.
- Rerun and validate downstream stages too.
- Document the root cause and the preventive action.
If you need more detail from the runner, enable debug logging. GitHub Actions supports step debug logs through a repository variable or secret named ACTIONS_STEP_DEBUG. Be careful with GitLab’s CI_DEBUG_TRACE, because it can print secret values into logs.
| Failure symptom | Likely cause | First diagnostic action |
| Build job fails | Compilation or configuration issue | Inspect the first build error |
| Tests fail intermittently | Flaky tests or unstable environment | Compare test runs and environment state |
| Dependency installation fails | Registry issue or version conflict | Read package manager output and the lockfile diff |
| Docker image cannot build | Dockerfile or base image issue | Review full build output and image configuration |
| Deployment fails | Permissions or environment mismatch | Check deployment logs and access policies |
| Pipeline times out | Resource or network bottleneck | Inspect runner utilization and job duration |
CI/CD Pipeline Troubleshooting Tools in 2026
The best CI/CD tools are the ones that shorten the path from a red build to a cause. Think in categories:
- CI/CD platforms: Jenkins, GitHub Actions, GitLab CI/CD, Azure Pipelines, and CircleCI provide job logs, pipeline graphs, reruns, and debug options. They show you where a run failed.
- Containers and orchestration: Docker reproduces the build environment locally. Kubernetes commands reveal why a deployment is unhealthy.
- Monitoring and observability: Prometheus and Grafana track metrics like job duration and failure rate, and OpenTelemetry can be used to trace pipeline runs across systems. They show you patterns, not just single failures.
- Code quality and security: SonarQube enforces quality gates. Trivy and Snyk scan images and dependencies. They explain why a gate failed.
If you use GitLab, a few GitLab CI best practices prevent many of the failures above: share configuration with include and extends, declare job order with needs, key caches on lockfile contents, store credentials in protected variables, and keep stage names clear. See the GitLab CI/CD documentation for syntax. No single tool solves every pipeline problem, so pick tools for the failure types you actually see.
CI/CD Best Practices to Prevent Pipeline Failures
These CI/CD best practices target the root causes above:
- Keep stages modular, so each failure points to one place.
- Use consistent environments for build and test, ideally the same container image.
- Pin dependency and tool versions, and commit lockfiles.
- Automate meaningful tests, including unit, integration, and security checks.
- Add a CI build gate that blocks merges when required checks fail.
- Use caching carefully, with keys that change when dependencies change.
- Manage secrets in a secrets manager, not in code or logs.
- Apply least privilege to tokens, runners, and deploy roles.
- Track pipeline duration and failure rate to spot regressions early.
- Version artifacts and build reproducibly.
- Add deployment health checks and verify each release.
- Keep rollback procedures documented and tested.
- Fix or quarantine flaky tests instead of rerunning them.
- Record recurring failures and their root causes.
Together these improve reliability, release confidence, and developer productivity. Fixing recurring pipeline problems takes engineering time that feature work often crowds out. Some teams bring in extra DevOps-capable engineers, for example dedicated developers from HireDeveloper.dev, to harden pipelines while the core team keeps shipping.
CI/CD Pipeline Security: Common Risks and Prevention
Pipelines hold credentials and run code with real access, which makes them a target. Common risks include exposed secrets, insecure third-party dependencies, untrusted code execution, excessive permissions, compromised build agents, vulnerable container images, and insecure deployment credentials. The OWASP Top 10 CI/CD Security Risks is a good checklist.
Two real incidents show why this matters. In March 2025, attackers modified version tags of the popular tj-actions/changed-files GitHub Action so workflows leaked secrets into logs (CVE-2025-30066). In March 2026, the Trivy scanner’s GitHub Action and a release were compromised in a similar way (advisory). In both cases, workflows that referenced mutable tags were exposed.
Practical protections:
- Pin third-party actions and images to full commit SHAs or digests.
- Use a secrets manager and role-based access with least privilege.
- Scan dependencies and container images in the pipeline.
- Use protected branches and protected variables.
- Store artifacts securely and sign them where practical.
- Review audit logs and pipeline access regularly.
Advanced CI/CD Pipeline Optimization Strategies
Once the basics are stable, these strategies improve both speed and resilience. Each has trade-offs:
- Parallel jobs cut duration but can cause resource contention and expose tests that share state.
- Selective or incremental testing runs only affected tests. It saves time but needs reliable change detection.
- Intelligent caching and artifact reuse avoid repeat work, though bad cache keys cause stale builds.
- Reusable pipeline templates reduce drift between projects at the cost of central maintenance.
- Infrastructure as Code and ephemeral build environments make runs reproducible and isolated.
- Blue-green and canary deployments limit the blast radius of a bad release, and automated rollback with health checks shortens recovery.
- Pipeline observability turns failure trend analysis into a routine, so you fix the top recurring cause first.
CI/CD Pipeline Failure Checklist
Run through this when a pipeline fails:
- Which stage failed, and what is the first error?
- What changed in code and configuration recently?
- Did dependency versions change?
- What do the test reports show?
- Are environment variables and secrets present and in scope?
- Does the runner have enough CPU, memory, and disk?
- Are the network and registries reachable?
- Does the deploy role have the needed permissions?
- Are artifacts and caches correct and fresh?
- Is rollback ready if this reaches production?
Conclusion: Building More Reliable CI/CD Pipelines
Pipeline failures usually come from a small set of causes: unstable environments, loose dependencies, brittle tests, weak configuration, and fragile credentials. Systematic troubleshooting beats guesswork, and automation, monitoring, testing, and security checks keep the same failures from returning. Teams that treat every failure as a root-cause problem, not a rerun, build pipelines they can trust. Your next step: pick the single most frequent failure in your pipeline this month, trace it to its cause, and add one check that prevents it.
Need extra engineering capacity?
If your team needs extra engineering capacity to stabilize pipelines or deliver on your roadmap, explore how HireDeveloper.dev can support you with dedicated developers.